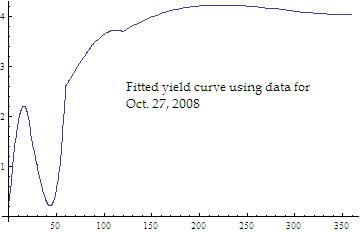
Yet another attempt to make sense out of current treasury interest rate data is given here. I am finding it hard to find a nice analytic equation for the current interest data. Does this mean anything? I am not sure.
There is no question that this is a "fairly" bumpy time in the economy. I thought I would expend some effort to try to explain the current interest rate data (yield curve). I have not been successful so far.
Treasury note data is as of 12:45 p.m. EDT 10/27/08 is given below.
1-Month Bill 0/32 0.319
3-Month Bill -4/32 0.757
6-Month Bill -4/32 1.321
2-Year Note -4/32 1.565
5-Year Note -7/32 2.614
10-YR Note -6/32 3.703
30-Year Bond 2/32 4.050
The fitted curve to the above data is given below.
