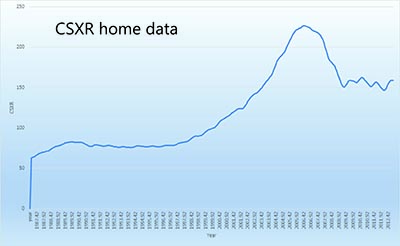
A plot of home prices using Case Shiller data is shown in the graphic below.
This plot is of the 10 city csxr index over a time period from about 1987. The right side of the graph shows that the home prices have been somewhat wobbling over the last several years. It's not great news; but it's also not bad news.
The short table below gives some numerical values. Column 1 is the year, column 2 is the 10 city csxr index value, and column 3 is the year to year (12 month) percentage increase.
2012.00 148.00  -4.12
2012.08 146.64  -3.77
2012.17 146.46  -2.95
2012.25 148.45  -2.19
2012.33 151.75  -1.03
2012.42 154.97  0.06
2012.50 157.24  0.58
2012.58 158.54  1.30
2012.67 158.87  2.09
2012.75 158.77  3.41
It is seen that the October 2012 csxr value of 159 is 3.41% higher than the value one year ago.
