George Schils Business Blog - BZ Bread

Business, Finance, Economics - Applications for Math and Statistics

See these blog qualifications.

This blog is part of Barry Zillman's Bread Rolls or BZ Bread for short.

Also see my main business blog page.

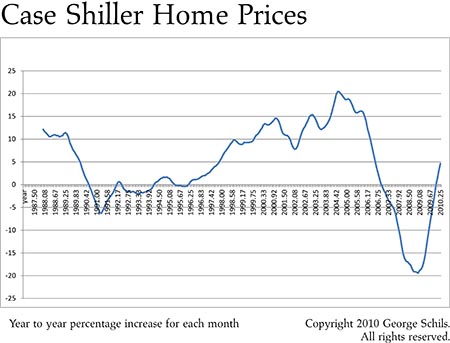
Case Shiller home prices through April 2010
29th June 2010

The graph below shows the percentage increases in home prices from year to year. That is, this is a 12 month price percentage change.

Year to year percentage home price increases

From April, 2009 to April, 2010, home prices have increased 4.61%. This is the right most point in the graph above. The 12 month percentage gains appear to be increasing since the number for last month (March) was 3.14%. We have used the Case Shiller CSXR 10-city composite index in this analysis with non seasonally adjusted data.
Tags: case shiller home prices, home prices, housing, housing price graph.

Created by Chronicle v4.6

The "George Schils Business Blog - BZ Bread -- Business, Finance, Economics - Applications for Math and Statistics" blog is copyright 2008-2013 George Schils.
All rights reserved.