by George Schils.
Tuesday, June 29, 2010
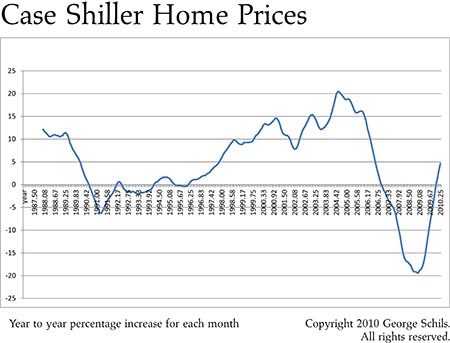
The graph below shows the percentage increases in home prices from year to year. That is, this is a 12 month price percentage change.
From April, 2009 to April, 2010, home prices have increased 4.61%. This is the right most point in the graph above. The 12 month percentage gains appear to be increasing since the number for last month (March) was 3.14%. We have used the Case Shiller CSXR 10-city composite index in this analysis with non seasonally adjusted data.
BZ Bread
Copyright 2009-2013 George Schils.
All rights reserved.