by George Schils.
Monday, June 07, 2010
Case Shiller had stopped publishing its data in spreadsheet format. Or at least I was not able to locate their data in this format. I recently noticed that their data seems to be available in spread sheet format again, so I have resumed doing house price analysis. The analysis here is very similar to what I have been doing in the past but the data has been updated.
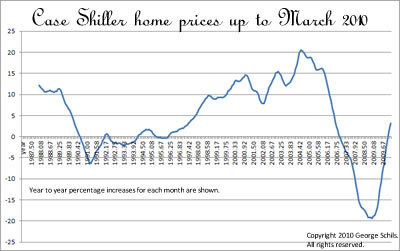
The graph below shows the percentage increases in home prices from year to year. That is, this is a 12 month price percentage change.
From March, 2009 to March, 2010, home prices have increased 3.15%. This is the right most point in the graph above. We have used the Case Shiller CSXR 10-city composite index in this analysis.
BZ Bread
Copyright 2009-2013 George Schils.
All rights reserved.