George Schils Business Blog - BZ Bread

Business, Finance, Economics - Applications for Math and Statistics

See these blog qualifications.

This blog is part of Barry Zillman's Bread Rolls or BZ Bread for short.

Also see my main business blog page.

Entries from September 2009.

Case Shiller home prices rise month to month for June 2009
2nd September 2009

Home prices increased by 1.4% from May to June 2009, according to recent Case Shiller data.

Here we use the CSXR 10 city index. This index showed a month to month percentage increase in home prices of 1.40%, and that the year to year increase was -15.13% (from June 2008 to June 2009).

The graph below shows the percentage month to month changes in the CSXR index. These are monthly percentages and are not annualized. It seems clear that home prices are on the increase again. A respectable increase is seen at the right side of the graph.
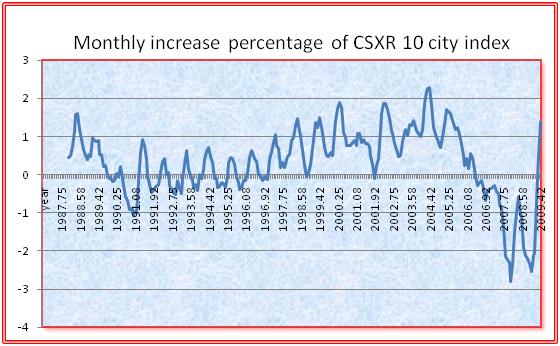
Monthly percentage home price 
increases

The 1.4% monthly increase translates to a very high yearly percentage. The real interesting question is what next month's data will show.

Tags: case shiller home prices, home prices, housing, housing price graph.
CPI data for August 2009
16th September 2009

Analysis of cpi from data released on September 16, 2009 shows that the cpi increased by 0.2% from July to August, but that the cpi is lower by 1.5% from the same month (August 2008) a year ago. The data is given below.

12 month percent change

Year Jan Feb Mar  Apr  May  Jun  Jul  Aug
2009 0.0 0.2 -0.4 -0.7 -1.3 -1.4 -2.1 -1.5 

1 month percent change

Year Jan Feb Mar Apr May Jun Jul  Aug 
2009 0.4 0.5 0.2 0.2 0.3 0.9 -0.2 0.2 

Data is from the Bureau of Labor Statistics, and series CUUR0000AA0 is used. Data here is normalized so that 1967=100.

Tags: cpi, data, inflation.
Case Shiller home price CSXR index rises month to month for third straight month
29th September 2009

Home prices increased by 1.65% from June 2009 to July 2009, according to recent Case Shiller data.

The table below shows detailed data for the last seven months. The second column is the increase percentage for the same month one year ago. Column 4 is the monthly percentage increase. A new calculation is column 3, which is a kind of second derivative of the CSXR value - this is the home price acceleration. This is calculated as the difference between the yearly home price increases: the July 2009 acceleration is calculated as -15.07 - -12.77 = 2.30. In other words, the numbers for the year to year increases although still negative are increasing at an increasing rate.

January 2009    -19.44  -0.21   -2.55
February 2009   -18.88  0.55    -2.12
March 2009      -18.62  0.26    -2.04
April 2009      -17.96  0.66    -0.68
May 2009        -16.76  1.20    0.47
June 2009       -15.07  1.69    1.45
July 2009       -12.77  2.30    1.65

These numbers are for the CSXR 10-city index. Most media reports are for the 20-city index, so the results here are an interesting companion to other popular media reports.

From column 3 it is clear that home prices have accelerated for six months straight, and the acceleration is increasing.

Home prices are still lower than they were a year ago (by 12.8%) but at the same time home prices are accelerating.

Tags: case shiller home prices, home prices, housing.

RSS Feed

Created by Chronicle v4.6

The "George Schils Business Blog - BZ Bread -- Business, Finance, Economics - Applications for Math and Statistics" blog is copyright 2008-2013 George Schils.
All rights reserved.