This business math blog contains spontaneous and quick writeups of business related math. Math here is often practical, useful, or intuitive.
See these blog qualifications.
This blog is part of Barry Zillman's Bread Rolls or BZ Bread for short.
Also see my main business blog page.
This business math blog contains spontaneous and quick writeups of business related math. Math here is often practical, useful, or intuitive.
A few days ago I did a curve fit to bond interest rates. The yield curve that I obtained is shown below.
Here the x-axis is in months.
Treasury note data is as of 5:22 p.m. EDT 10/16/08 (Treasuries data is from WSJ.com.)
1-Month Bill* 2/32 0.091
3-Month Bill* 8/32 0.497
6-Month Bill* 8/32 1.147
2-Year Note* -5/32 1.637
5-Year Note* -5/32 2.852
10-YR Note* -6/32 3.970
30-Year Bond* -1 1/32 4.254
It is interesting that the 1-month note bears an interest rate of near zero. Even though the short term inter-rate bank lending rate is very high, the Federal rate is near zero.
The Fed has been pushing down short term interest rates by instrumenting rate cuts. They keep pushing down the short end when it rises and this keeps the yield curve from inverting. Yield curve inversion, which we do not have here, is one indication of a recession.
The yield curve using data points is shown below.
And the fitted curve is given next.
Here are some links to useful sources of real time financial data.
My pop Business and Finance web pages contain some additional links and related discussion.
Government home data is given here. Data here can be found that is directly in Excel format. In general quite a bit of data is available from the U. S. Government.
Yet another attempt to make sense out of current treasury interest rate data is given here. I am finding it hard to find a nice analytic equation for the current interest data. Does this mean anything? I am not sure.
There is no question that this is a "fairly" bumpy time in the economy. I thought I would expend some effort to try to explain the current interest rate data (yield curve). I have not been successful so far.
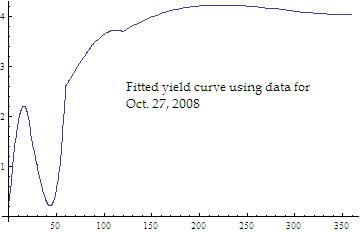
Treasury note data is as of 12:45 p.m. EDT 10/27/08 is given below.
1-Month Bill 0/32 0.319
3-Month Bill -4/32 0.757
6-Month Bill -4/32 1.321
2-Year Note -4/32 1.565
5-Year Note -7/32 2.614
10-YR Note -6/32 3.703
30-Year Bond 2/32 4.050
The fitted curve to the above data is given below.
See the Case Shiller home price index. Quite a bit of data can be found here.
Some information on the Crash of 1929 is found on the Wikipedia. Also see the Great Depression discussion. Some interesting points to note from these articles are that:
I originally set out to show that a deficit of $750 billion dollars divided among a population of about 300 million people results in a deficit of $2500 per person. This sounds "not bad". But then consider the total debt, not just "the deficit".
The National Debt Clock shows a debt of almost $35000 per U.S. citizen. This number is obtained as:
10.5 trillion / 305 million people
= $34426 per U. S. citizen
Updated from:
Created by Chronicle v4.6
The
"George Schils Business Blog - BZ Bread
--
Business, Finance, Economics - Applications for Math and Statistics"
blog
is copyright 2008-2013 George Schils.
All rights reserved.